The subject of memory management of Operating Systems in vSphere is an enormously broad, and complex topic that has been covered quite well over the years. With all of that great information, there are characteristics with some of the metrics given that still seem to befuddle users. One of those metrics provided to us courtesy of vSphere is "Active Memory." I hope to provide a few real world examples of why this confusion occurs, and what to look out for in your own environment.
vSphere attempts to interpret how much memory is being actively used by a VM, and displays this in the form of “Active Memory.” The VMkernel bases this estimate off of recently touched memory pages by the guest OS for a given sampling period. It then displays it as an average for that sampling period (maximums and minimums exposed with higher logging levels). It is a metric that has proven to be quite controversial. Some have grown frustrated by the perceived inaccuracies of it, but I believe the problem is not in the metric’s accuracy, but a misunderstanding of how it collects it’s data, and it’s meaning. Having additional data points to understand the behavior of your workload is a good thing. It is critical to know what it really means, and how different Operating Systems and applications may provide different results to this metric.
There are a wealth of good sources (a few links at the end of this post) on defining what Active Memory is as it relates to vSphere. The two takeaways of the Active Memory metric I like to remember is that 1.) It is a statistical estimate, and 2.) It represents a single sample period. In other words, it has no relationship to previous samplings, and therefore, may or may not represent the same memory pages accessed.
The Risk
"We have met the enemy, and he is us." — Walt Kelly as Pogo
Since Active Memory is a unique metric outside of the paradigm of the OS, translating what it means to you, the application, or the guest OS can be prone to misinterpretation. The risk is interpreting it’s meaning incorrectly, and perhaps using it as the primary method for right sizing a VM. Interestingly enough, this can lead to both oversized VMs, and undersized VMs.
I believe that one thing that gets Administrators off on the wrong foot is vSphere’s own baked-in alarm of "Virtual Machine Memory Usage." This "Usage" metric is a percentage of total available memory for the VM, and is tied to the Active Memory metric in vSphere. It implies that when it is high, the VM is running out of memory, and when it is low, it is performing as designed with no memory issues. I will demonstrate how under certain circumstances, both of these assumptions can be wrong.
Oversizing
Oversizing a VM’s resources is not an uncommon occurrence. You would think spotting these systems might be easy and obvious. That is not always the case.
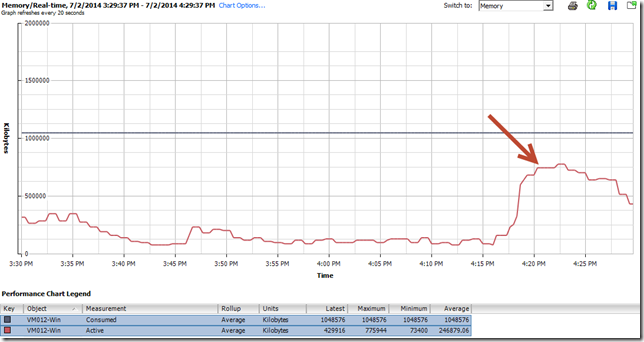
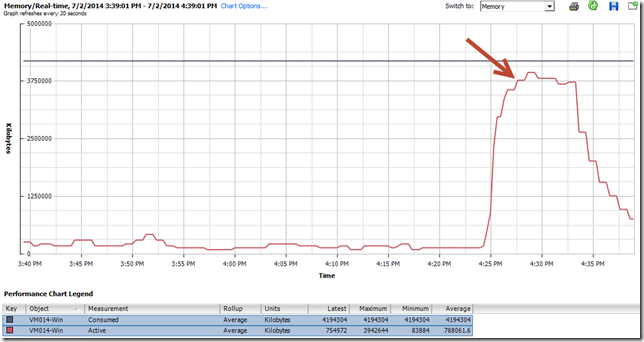
With respect to memory sizing, let’s do a little experiment. The example below is a bulk file copy (11 gigabytes worth of large and small files) from a Linux machine. The target can be local, or remote. The effect will be similar. We will observe the difference of Active Memory between the small VM (1GB of memory assigned), and the large VM (4GB of memory assigned), and what impacts it may or may not have on performance.
The Active Memory of the smaller Linux VM below
The Active Memory of the larger Linux VM below.
Note how the Active Memory increased on the 4GB Linux VM versus the 1GB Linux VM. This gives the impression that the file copy is using memory for the file copy job, and leaves less for the applications.
Now let us jump into ‘top’ inside the guest OS. It also shows figures that give the impression that the file copy using most of the memory for the copy job, and may trigger a vCenter Memory usage alarm.
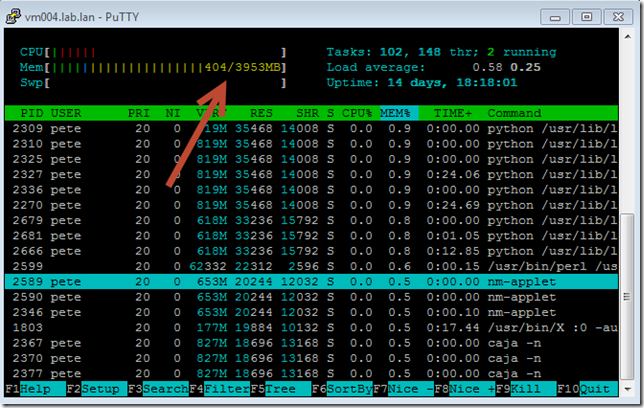
But in this case, top is not telling the entire story either. Let’s take a look at the same resource utilization inside the guest using ‘htop’
Let’s look at utilization inside the guest using "free -m"
So what is going on here? The Linux kernel will allocate memory that isn’t actively used by processes to other tasks like file system caches. This opportunistic use of memory will not interfere with other spawning processes. As soon as another process spawns, the Linux kernel will free that memory so that it can be used by the application. This is a clever use of resources, but as you can see, can also give the wrong impression inside the guest (via ‘top’), as well as in vSphere (via Active Memory). One can keep increasing the amount of memory assigned to a VM, and in many cases, this behavior will continue to occur. vSphere’s Active Memory metric does not attempt to distinguish what it is, beyond a change in value. In all cases, the memory statistics are not inaccurate, but just a different representation of memory usage.
The reason why I chose a bulk file copy as an experiment is because a file copy is largely perceived by the end user as being a storage I/O or network I/O matter. The behavior I described will most likely show up in Linux VMs being used as flat-file storage servers (something I see often), but is not limited to just that type of workload. I should also mention that during the testing, the ability for Linux to use memory for some of it’s file handling tasks was more noticeable when using slow backing storage in comparison to faster storage.
If you are purely a Windows shop, remember that this characteristic will show up with virtual appliances, as they are all Linux VMs. Lets take a look at that same bulk file copy in Windows, and see how it relates to Active Memory.
The Active Memory of the smaller Windows VM below.
The Active Memory of the larger Windows VM below.
Memory resources inside the guest of the larger Windows VM below.
The Windows Memory Manager seems to handle this same task differently. Semantics aside, when more memory is assigned to a VM, Windows appears to carve out more for this task, but seems to cap it’s ability, in favor of leaving the remaining memory space for already cached applications and data, (seen in the screen shots as “standby” and/or “free”). This is a simple indicator that various Operating Systems handle their memory management differently, and needs to be taken into consideration when a user is observing the Active Memory metric.
Undersizing
Undersizing a VM’s memory can stem from many reasons, but are most likely to show up on the following types of systems.
- Server performing multiple roles and not sized accordingly. (e.g. Front end web services with backend databases on the same system, like small SharePoint deployments)
- VMs right sized according to the Active Memory metric.
- SQL Servers.
- Exchange Servers.
- Servers running one or more Java applications.
With a SQL server, one can easily find a server where the "Active Memory" is quite low. Then, look inside the guest, and you will see utilization of memory is very high, and if the system resources were assigned pretty conservatively, will act sluggish.
Now look at it inside the guest, and you will see quite high utilization.
A few steps can help this matter.
- Use the SQL Server Monitoring Tools in Perfmon to better understand the problem. Be warned that you may have to invest significant time in this in order to get the scaling right, interpret, and validate the data correctly. Don’t rely solely on one metric to determine the state. For instance, the "SQL Server Buffer Manager: Buffer Cache Hit Ratio" is supposed to indicate insufficient memory for SQL if the ratio is a low number. However, I’ve seen memory starved systems still show this as a high value.
- Change SQL’s default configuration for managing memory. The default setting will let SQL absorb all of the memory, and leave little for the rest of the OS or the apps Set it to a fixed number below the amount assigned to the system. For example, if one had a 12GB SQL server, assign 6GB as the maximum server memory. This will allow for sufficient resources for the server OS an any other applications that run on the system.
- Document performance monitoring results, then increase the memory assigned to your VM. Then follow up with more performance monitoring to see any measurable results. One could simply increase the memory assigned and forget the other steps, but you’ll be relying completely on anecdotal observations to determine improvement.
Exchange is beginning to act more like SQL with each major release. Much like SQL, Exchange is now quite aggressive in its use of caching. It’s one of the reasons by the dramatic reductions in storage I/O demands over the last three major releases of Exchange. Also like SQL, having plenty of memory assigned will help compensate for slow backend storage. Starving the system of memory will create wildly unpredictable results, as it never has an opportunity to cache what it should.
Java will use its own memory manager. Java will need available memory space in each VM for each and every JVM running. Ultimately, the JVM applications will work best when a memory reservation is at minimum, set to the sum of all JVMs running on that VM . Be mindful of the implications that memory reservations can bring to the table. You can gain more insight as to the needs of Java inside the guest, by using various tools.
Other observations from a Production environment
A few other notes worth mentioning
1. Sometimes guest OS paging is monitored as an indicator of not enough memory. However, not all memory inside a guest OS will page when under pressure. If the applications or OS have pinned the memory, so you won’t see memory paging coming from them. One can be starving the app for memory, but it does not show via guest OS paging.
2. VMs with larger vCPU counts need a relative increase in memory assigned to the VM. I’ve have seen this in my environment, where a VM with a high vCPU count is under tremendous load, that not having enough memory will hinder performance. Simply put, more CPU cycles needs more memory addresses to work with.
3. Server memory might not be cheap, but neither is storage, and even fast storage is several orders of magnitude slower than memory. The performance gain of assigning more memory to specific VMs (assuming your hosts/cluster can support it) can be immediate, and dramatic. No need to induce unnecessary paging if unnecessary.
4. Assigning more memory to a VM running a poorly designed or inefficient application will likely not help the application, and be a waste of resources. An application may be storage I/O heavy, no matter how much memory you assign it (think Exchange 2003).
One of my first and favorite VMworld breakout sessions I attended in 2010 was "Understanding Virtualization Memory Management Concepts" (TA7750 still found online) presented by Kit Colbert. Kit is now the CTO of End User Computing at VMware, but the sessions can still be found online. I recall sitting in that session, and within the first 5 minutes deciding that: 1.) I knew nothing about memory, especially with a Hypervisor, and 2.) The deep dive was so good, and the content so verbose, that any attempt at taking notes was pointless. I made it a point to attend this session each year that he presented it, as it represents the very best of what VMworld has to offer. Do yourself a favor and watch one of his sessions.
Conclusion
Memory can and will be measured differently by Hypervisors and Guest OSs. The definitions of terms related to memory may be different by the application, the guest OS, and the hypervisor. Understanding your workloads, and the characteristics of the platforms it uses will help you better size your VMs for the balance between optimal performance with a minimal footprint. Monitoring memory in a useful way can also be a time consuming, difficult task that extends well beyond just a simple metric.
Have fun
– Pete
Helpful links
Understanding vSphere Active Memory
http://blogs.vmware.com/vsphere/2013/10/understanding-vsphere-active-memory.html
Kit Colbert’s 2011 VMworld breakout session – Understanding Virtualized Memory Performance Management
https://www.youtube.com/watch?v=YKaUtoQrLjo
Monitor Memory Usage in SQL Server
http://msdn.microsoft.com/en-us/library/ms176018.aspx
SQL Server on VMware Best Practices guide
http://www.vmware.com/files/pdf/solutions/SQL_Server_on_VMware-Best_Practices_Guide.pdf
VMware KB 1687: Excessive Page Faults Generated by Windows applications
http://kb.vmware.com/selfservice/microsites/search.do?language=en_US&cmd=displayKC&externalId=1687
A vSphere & memory related post would not be complete without mention of the venerable "vSphere Clustering Deepdive"
http://www.amazon.com/VMware-vSphere-5-1-Clustering-Deepdive-ebook/dp/B0092PX72C/ref=sr_1_1?ie=UTF8&qid=1404234460&sr=8-1&keywords=vsphere+5+clustering+deep+dive


