In the post Understanding block sizes in a virtualized environment, I describe what block sizes are as they relate to storage I/O, and how it became one of the most overlooked metrics of virtualized environments. The first step in recognizing their importance is providing visibility to them across the entire Data Center, but with enough granularity to view individual workloads. However, visibility into a metric like block sizes isn’t enough. The data itself has little value if it cannot be interpreted correctly. The data must be:
- Easy to access
- Easy to interpret
- Accurate
- Easy to understand how it relates to other relevant metrics
- Future posts will cover specific scenarios detailing how this information can be used to better understand, and tune your environment for better application performance. Let’s first learn how PernixData Architect presents block size when looking at very basic, but common read/write activity.
Block size frequencies at the Summary View
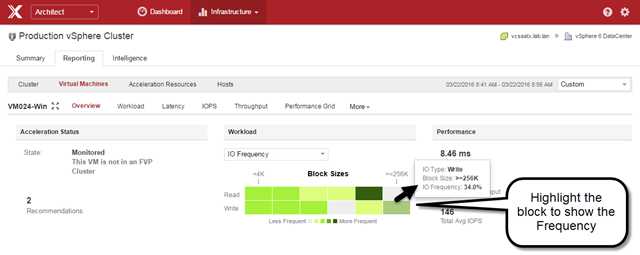
When looking at a particular VM, the "Overview" view in Architect can be used to show the frequency of I/O sizes across the spectrum of small blocks to large blocks for any time period you wish. This I/O frequency will show up on the main Summary page when viewing across the entire cluster. The image below focuses on just a single VM.
(Click on images for a full size view)
What is most interesting about the image above is that the frequency of block sizes, based on reads and writes are different. This is a common characteristic that has largely gone unnoticed because there has been no way to easily view that data in the first place.
Block sizes using a "Workload" View
The "Workload" view in Architect presents a distribution of block sizes in a percentage form as they occur on a single workload, a group of workloads, or across an entire vSphere cluster. The time frame can be any period that you wish. This view tells more clearly and quickly than any other view as to how complex, unique, and dynamic the distribution of block sizes are for any given VM. The example below represents a single workload, across a 15 minute period of time. Much like read/write ratios, or other metrics like CPU utilization, it’s important to understand these changes as they occur, and not just a single summation or percentage over a long period of time.
When viewing the "Workload" view in any real world environment, it will instantly provide new perspective on the limitations of Synthetic I/O generators. Their general lack of ability to emulate the very complex distribution of block sizes in your own environment limit their value for that purpose. The "Workload" view also shows how dramatic, and continuous the changes in workloads can be. This speaks volumes as to why one-time storage assessments are not enough. Nobody treats their CPU or memory resources in that way. Why would we limit ourselves that way for storage?
Keep in mind that the "Workload" view illustrates this distribution in a percentage form. Views that are percentage based aim to illustrate proportion relative to a whole. They do not show absolute values behind those percentages. The distribution could represent 50 IOPS, or 5,000 IOPS. However, this type of view can be an incredibly effective in identifying subtle changes in a workload or across an environment for short term analysis, or long term trending.
Block sizes in an IOPS and Throughput view
First let’s take a look at this VM by looking at IOPS, based on a default "Read/Write" breakdown. The image below shows a series of reads before a series of mostly writes. When you look back at the "Workload" view above, you can see how these I/Os were represented by block size distribution.
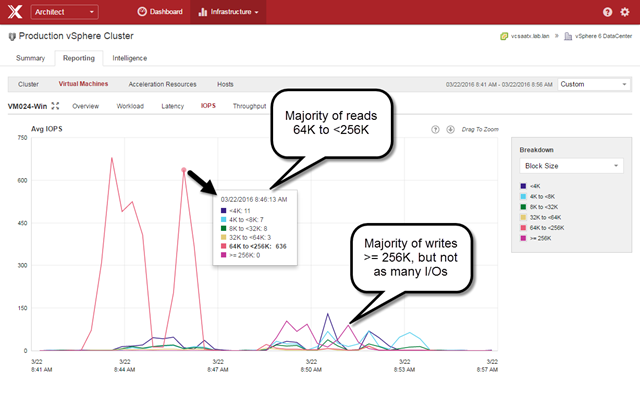
Staying on this IOPS view and selecting the predefined "Block Size" breakdown, we can see the absolute numbers that are occurring based on block size. The image below shows that unlike the "Workload" view above, this shows the actual number of I/Os issued for the given block size.
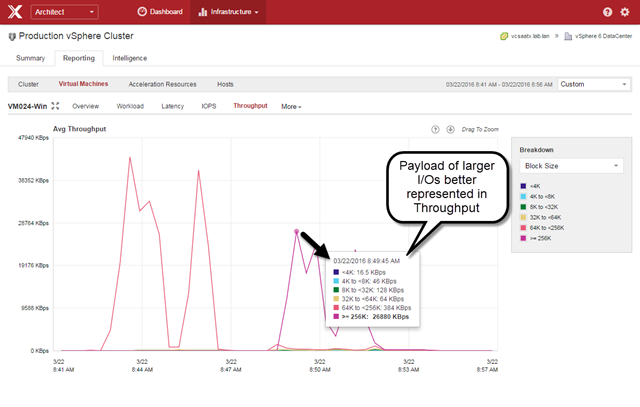
But that doesn’t tell the whole story. A block size is an attribute for a single I/O. So in an IOPS view 10 IOPS of 4K blocks looks the same as 10 IOPS of 256K blocks. In reality, the latter is 64 times the amount of data. The way to view this from a "payload amount transmitted" perspective is using the Throughput view with the "Block Size" breakdown, as shown below.
When viewing block size by its payload size (Throughput) as shown above, it provides a much better representation of the dominance of large block sizes, and the relatively small payload of the smaller block sizes.
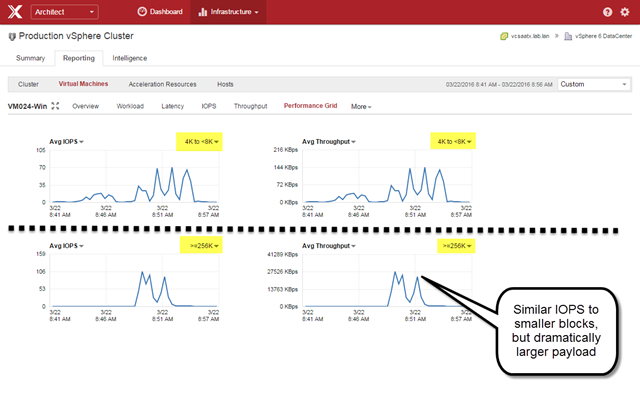
Here is another way Architect can help you visualize this data. We can click on the "Performance Grid" view and change the view so that we have IOPS and Throughput but for specific block sizes. As the image below illustrates, the top row shows IOPS and Throughput for 4K to <8K blocks, while the bottom row shows IOPS and Throughput for blocks over 256K in size.
What the image above shows is that while the number of IOPS for block sizes in the 4K to <8K range at it’s peak were similar to the number of IOPS for block sizes of 256K and above, there was an enormous amount of payload delivered.
Why does it matter?
Let’s let PernixData Architect tell us why all of this matters. We will look at the effective latency of the VM over that same time period. We can see from the image below that the effective latency of the VM definitely increased as it transitioned to predominately writes. (Read/Write boxes unticked for clarity).
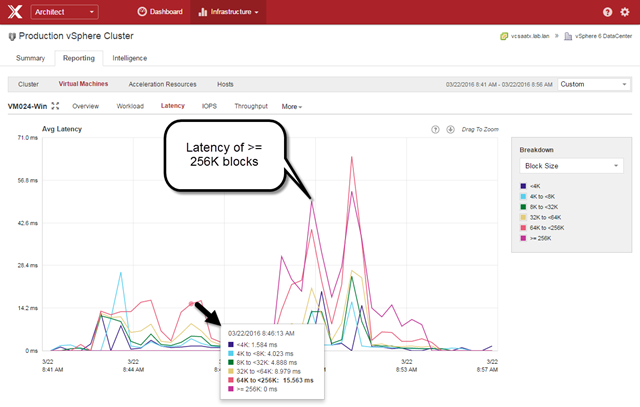
Now, let’s look at the image below, which shows latency by block size using the "Block Size" breakdown.
There you see it. Latency was by in large a result of the larger block sizes. The flexibility of these views can take an otherwise innocent looking latency metric and tell you what was contributing most to that latency.
Now let’s take it a step further. With Architect, the "Block Size" breakdown is a predefined view that shows block size characteristic of both reads, and writes combined – whether you are looking at Latency, IOPS, or Throughput. However, you can use a custom breakdown to not only show block sizes, but show them specifically for reads or writes, as shown in the image below.
The "Custom" Breakdown for the Latency view shown above had all of the reads and writes of individual block sizes enabled, but some of them were simply "unticked" for clarity. This view confirms that the majority of latency was the result of writes that were 64K and above. In this case, we can clearly demonstrate that latency seen by the VM was the result of larger block sizes issued by writes. It’s impact however is not limited to just the higher latency of those larger blocks, as those large block latencies can impact the smaller block I/Os as well. Stay tuned for more information on that subject.
As shown in the image below, Architect also allows you to simply click on a single point, and drill in for more insight. This can be done on a per VM basis, or across the entire cluster. By hovering over each vertical bar representing various block sizes, it will tell you how many IOs were issued at that time, and the corresponding latency.
Flash to the rescue?
It’s pretty clear that block size can have significant impact on the latency your applications see. Flash to the rescue, right? Well, not exactly. All of the examples above come from VMs running on Flash. Flash, and how it is implemented in a storage solution is part of what makes this so interesting, and so impactful to the performance of your VMs. We also know that the storage media is just one component of your storage infrastructure. These components, and their abilities to hinder performance, exist regardless if one is using a traditional three-tier architecture, or distributed storage architectures like Hyper Converged environments.
Block sizes in the Performance Matrix
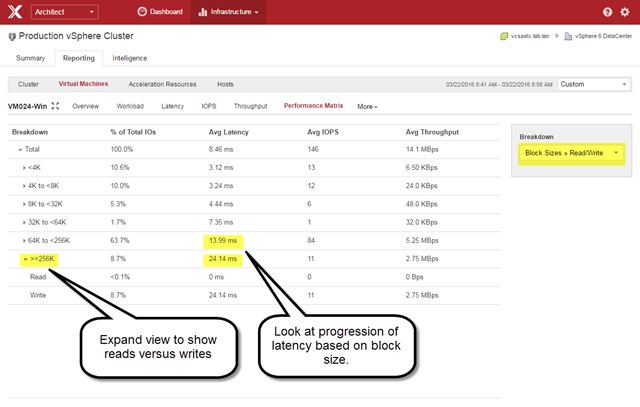
One unique view in Architect is the Performance Matrix. Unique in what it presents, and how it can be used. Your storage solution might have been optimized from the Manufacturer based on certain assumptions that may not align with your workloads. Typically there is no way of knowing that. As shown below, Architect can help you understand what type of workload characteristics in which the array begins to suffer.
The Performance Matrix can be viewed on a per VM basis (as shown above) or in an aggregate form. It’s a great view to see what block size thresholds your storage infrastructure may be suffering, as the VMs see it. This is very different than statistics provided by an array, as Architect offers a complete, end-to-end understanding of these metrics with extraordinary granularity. Arrays are not in the correct place to accurately understand, or measure this type of data.
Summary
Block sizes have a profound impact on the performance of your VMs, and is a metric that should be treated as a first class citizen just like compute and other storage metrics. The stakes are far too high to leave this up to speculation, or words from a vendor that say little more than "Our solution is fast. Trust us." Architect leverages it’s visibility of block sizes in ways that have never been possible. It takes advantage of this visibility to help you translate what it is, to what it means for your environment.

