I love a good benchmark as much as the next guy. But success in the datacenter is not solely predicated on the results of a synthetic benchmark, especially those that do not reflect a real workload. This was the primary motivation in upgrading my production environment to FVP 2.0 as quickly as possible. After plenty of testing in the lab, I wanted to see how the new and improved features of FVP 2.0 impacted a production workload. The easiest way to do this is to sit back and watch, then share some screen shots.
All of the images below are from my production code compiling machines running at random points of the day. The workloads will always vary somewhat, so take them as more "observational differences" than benchmark results. Also note that these are much more than the typical busy VM. The code compiling VMs often hit the triple crown in the "difficult to design for" department.
- Large I/O sizes. (32K to 512K, with most being around 256K)
- Heavy writes (95% to 100% writes during a full compile)
- Sustained use of compute, networking, and storage resources during the compiling.
The characteristics of flash under these circumstances can be a surprise to many. Heavy writes with large I/Os can turn flash into molasses, and is not uncommon to have sporadic latencies well above 50ms. Flash has been a boon for the industry, and has changed almost everything for the better. But contrary to conventional wisdom, it is not a panacea. The characteristics of flash need to be taken into consideration, and expectations should be adjusted, whether it be used as an acceleration resource, or for persistent data storage. If you think large I/O sizes do not apply to you, just look at the average I/O size when copying some files to a file server.
One important point is that the comparisons I provide did not include any physical changes to my infrastructure. Unfortunately, my peering network for replica traffic is still using 1GbE, and my blades are only capable of leveraging Intel S3700 SSDs via embedded SAS/SATA controllers. The VMs are still backed by a near end-of-life 1GbE based storage array.
Another item worth mentioning is that due to my workload, my numbers usually reflect worst case scenarios. You may have latencies that are drastically lower than mine. The point being that if FVP can adequately accelerate my workloads, it will likely do even better with yours. Now let’s take a look and see the results.
Adaptive Network Compression
Specific to customers using 1GbE as their peering network, FVP 2.0 offers a bit of relief in the form of Adaptive Network Compression. While there is no way for one to toggle this feature off or on for comparison, I can share what previous observations had shown.
FVP 1.x
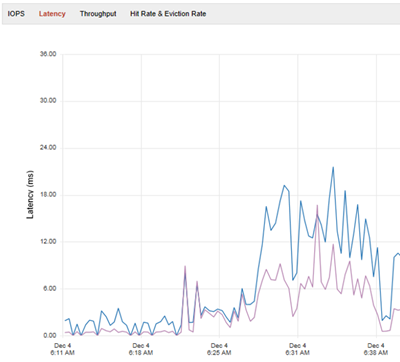
Here is an older image a build machine during a compile. This was in WB+1 mode (replicating to 1 peer). As you can see, the blue line (Observed VM latency) shows the compounding effect of trying to push large writes across a 1GbE pipe, to SATA/SAS based Flash devices was not as good as one would hope. The characteristics of flash itself, along with the constraints of 1GbE were conspiring with each other to make acceleration difficult.
FVP 2.0 using Adaptive Network Compression
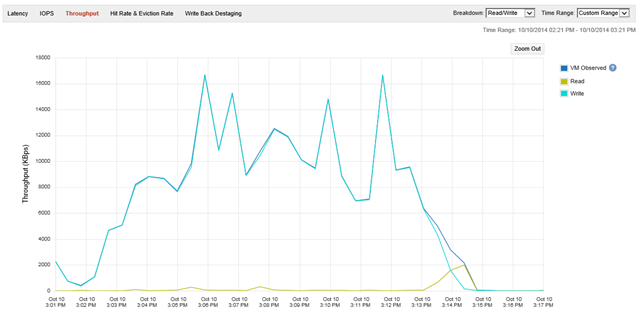
Before I show the comparison of effective latencies between 1.x and 2.0, I want to illustrate the workload a bit better. Below is a zoomed in view (about a 20 minute window) showing the throughput of a single VM during a compile job. As you can see, it is almost all writes.
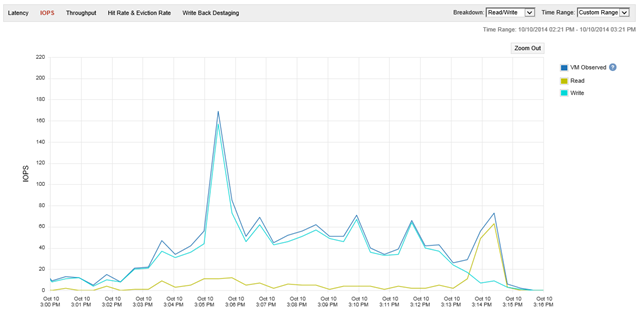
Below shows the relative number of IOPS. Almost all are write IOPS, and again, the low number of IOPS relative to the throughput is an indicator of large I/O sizes. Remember that with 512K I/O sizes, it only takes a couple of hundred IOPS to nearly saturate a 1GbE link – not to mention the problems that flash has with it.
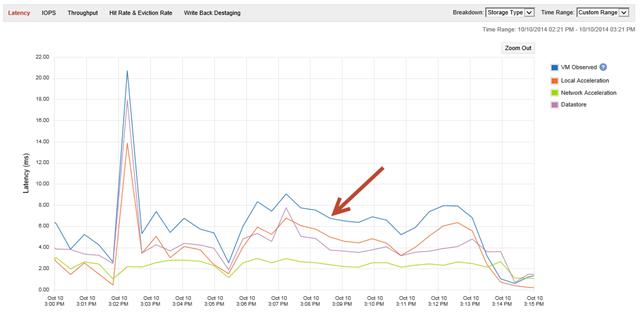
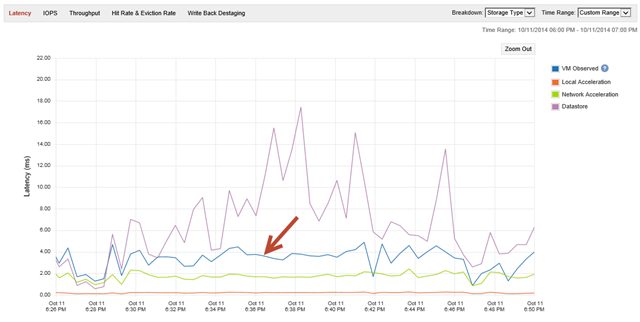
Now let’s look at latency on that same VM, during that same time frame. In the image below, the blue line shows that the VM observed latency has now improved to the 6 to 8ms range during heavy writes (ignore the spike on the left, as that was from a cold read). The 6 to 8ms of latency is very close to the effective latency of a WB+0, local flash device only configuration.
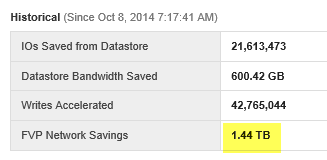
Using the same accelerator device (Intel S3700 on embedded Patsburg controllers) as in 1.x, the improvements are dramatic. The "penalty" for the redundancy is greatly reduced to the point that the backing flash may be the larger contributor to the overall latency. What has really been quite an eye opener is how well the compression is helping. In just three business days, it has saved 1.5 TB of data running over the peer network. (350 GB of savings coming from another FVP cluster not shown)
Distributed Fault Tolerant Memory
If there is one thing that flash doesn’t do well with, it is writes using large I/O sizes. Think about all of the overhead that comes from flash (garbage collection, write amplification, etc.), and that in my case, it still needs to funnel through an overwhelmed storage controller. This is where I was looking forward to seeing how Distributed Fault Tolerant Memory (DFTM) impacted performance in my environment. For this test, I carved out 96GB of RAM on each host (384GB total) for the DFTM Cluster.
Let’s look at a similar build run accelerated using write-back, but with DFTM. This VM is configured for WB+1, meaning that it is using DFTM, but still must push the replica traffic across a 1GbE pipe. The image below shows the effective latency of the WB+1 configuration using DFTM.
The image above shows that using DFTM in a WB+1 mode eliminated some of that overhead inherent with flash, and was able to drop latencies below 4ms with just a single 1GbE link. Again, these are massive 256K and 512K I/Os. I was curious to know how 10GbE would have compared, but didn’t have this in my production environment.
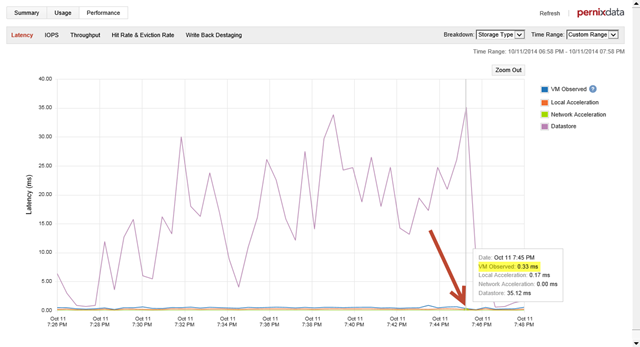
Now, let’s try DFTM in a WB+0 mode. Meaning that it has no peering traffic to send it to. What do the latencies look like then for that same time frame?
If you can’t see the blue line showing the effective (VM observed) latencies, it is because it is hovering quite close to 0 for the entire sampling period. Local acceleration was 0.10ms, and the effective latency to the VM under the heaviest of writes was just 0.33ms. I’ll take that.
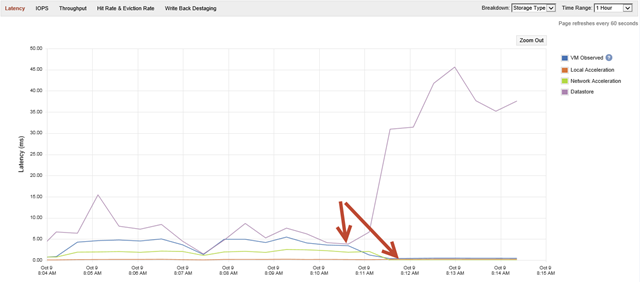
Here is another image of when I turned a DFTM accelerated VM from WB+1 to WB+0. You can see what happened to the latency.
Keep in mind that the accelerated performance I show in the images above come from a VM that is living on a very old Dell EqualLogic PS6000e. Just fourteen 7,200 RPM SATA drives that can only serve up about 700 IOPS on a good day.
An unintended, but extremely useful benefit of DFTM is to troubleshoot replica traffic that has higher than expected latencies. A WB+1 configuration using DFTM eliminates any notion of latency introduced by flash devices or offending controllers, and limits the possibilities to NICs on the host, or switches. Something I’ve already found useful with another vSphere cluster.
Simply put, DFTM is a clear winner. It can address all of the things that flash cannot do well. It avoids storage buses, drive controllers, NAND overhead, and doesn’t wear out. And it sits as close to the CPU with as much bandwidth as anything. But make no mistake, memory is volatile. With the exception of some specific use cases such as non persistent VDI, or other ephemeral workloads, one should take advantage of the "FT" part of DFTM. Set it to 1 or more peers. You may give back a bit of latency, but the superior performance is perfect for those difficult tier one workloads.
When configuring an FVP cluster, the current implementation limits your selection to a single acceleration type per host. So, if you have flash already installed in your servers, and want to use RAM for some VMs, what do you do? …Make another FVP cluster. Frank Denneman’s post: Multi-FVP cluster design – using RAM and FLASH in the same vSphere Cluster describes how to configure VMs in the same vSphere cluster to use different accelerators. Borrowing those tips, this is how my FVP clusters inside of a vSphere cluster look.
Write Buffer and destaging mechanism
This is a feature not necessarily listed on the bullet points of improvements, but deserves a mention. At Storage Field Day 5, Satyam Vaghani mentioned the improvements with the destaging mechanism. I will let the folks at PernixData provide the details on this, but there were corner cases in which VMs could bump up against some limits of the destager. It was relatively rare, but it did happen in my environment. As far as I can tell, this does seem to be improved.
Destaging visibility has also been improved. Ever since the pre 1.0, beta days, I’ve wanted more visibility on the destaging buffer. After all, we know that all writes eventually have to hit the backing physical datastore (see Effects of introducing write-back caching with PernixData FVP) and can be a factor in design. FVP 2.0 now gives two key metrics; the amount of writes to destage (in MB), and the time to the backing datastore. This will allow you to see if your backing storage can or cannot keep up with your steady state writes. From my early impressions, the current mechanism doesn’t quite capture the metric data at a high enough frequency for my liking, but it’s a good start to giving more visibility.
Honorable mentions
NFS support is a fantastic improvement. While I don’t have it currently in production, it doesn’t mean that I may not have it in the future. Many organizations use it and love it. And I’m quite partial to it in the old home lab. Let us also not dismiss the little things. One of my favorite improvements is simply the pre-canned 8 hour time window for observing performance data. This gets rid of the “1 day is too much, 1 hour is not enough” conundrum.
Conclusion
There is a common theme to almost every feature evaluation above. The improvements I showcase cannot by adequately displayed or quantified with a synthetic workload. It took real data to appreciate the improvements in FVP 2.0. Although 10GbE is the minimum ideal, Adaptive Network Compression really buys a lot of time for legacy 1GbE networks. And DFTM is incredible.
The functional improvements to FVP 2.0 are significant. So significant that with an impending refresh of my infrastructure, I am now taking a fresh look at what is actually needed for physical storage on the back end. Perhaps some new compute with massive amounts of PCIe based flash, and RAM to create large tiered acceleration pools. Then backing spindles supporting our capacity requirements, with relatively little data services, and just enough performance to keep up with the steady-state writes.
Working at a software company myself, I know all too well that software is never "complete." But FVP 2.0 is a great leap forward for PernixData customers.


Awesome writeup. Thanks Pete!
Thanks for reading Chethan!
Thanks for reading Tomas. Yes, I’ve been really surprised at how well the network compression works with real world data.
as usual very well written! The compression for Gbit network looks very nice indeed.