Most Data Center Administrators are accustomed to looking for high CPU utilization rates on VMs, and the hosts in which they reside. This shouldn’t be a big surprise. After all, vCenter, and other monitoring tools have default alarms to alert against high CPU usage statistics. Features like DRS, or products that claim DRS-like functionality factor in CPU related metrics as a part of their ability to redistribute VMs under periods of contention. All of these alerts and activities suggest that high CPU values are bad, and low values are good. But what if conventional wisdom on the consumption of CPU resources is wrong?
Why should you care
Infrastructure metrics can certainly be a good leading indicator of a problem. Over the years, high CPU usage alarms have helped correctly identified many rogue processes on VMs ("Hey, who enabled the screen saver via GPO?…"). But a CPU alarm trigger assumes that high CPU usage is always bad. It also implies that the absence of an alarm condition means that there is not an issue. Both assumptions can be incorrect, which may lead to bad decision making in the Data Center.
The subtleties of performance metrics can reveal problems somewhere else in the stack – if you know how and where to look. Unfortunately, when metrics are looked at in isolation, the problems remain hidden in plain sight. This post will demonstrate how a few common metrics related to CPU utilization can be misinterpreted. Take a look at the post Observations with the Active Memory metric in vSphere to see how this can happen with other metrics as well.
The testing
There are a number of CPU related metrics to monitor in the hypervisor, and at least a couple of different ways to look at them (vCenter, and esxtop). For brevity, lets focus on two metrics that readily visible in vCenter; CPU Usage and CPU Ready. This doesn’t dismiss the importance of other CPU related metrics, or the various ways to gather them, but it is a good start to understanding the relationship between metrics. As a quick refresher, CPU Usage as it relates to vCenter has two definitions. From the host, the usage is the percentage of CPU cycles in use against the total CPU cycles available on the host. On the VM, usage shows the percent of CPU resources in use against the total available CPU cycles of the vCPUs visible to the VM. CPU Ready in vCenter measures in summation form, the amount of time that the virtual machine was ready, but could not get scheduled to run on the CPU.
A few notes about the test conditions and results:
- The tests here comprise of activities that are scheduled inside each guest, and are repeated 5 times over a 1 hour period.
- There are no synthetic tools used here to generate storage I/O load or consume CPU cycles. (iometer, StressLinux, etc.)
- The activities performed are using processes that are only partially multithreaded. This approach is most reflective of real world environments.
- The "slower" storage depicted in the testing were actually SSDs, while the "faster" storage was by leveraging PernixData FVP and distributed fault tolerant memory (DFTM) as a storage acceleration tier.
- The absolute numbers are not necessarily important for this testing. The focus is more about comparing values when a variable like storage performance changes.
- No shares, reservations, or limits were used on the test VMs.
The complex demands of real world environments may exhibit a much greater impact than what the testing below reveals. I reference a few actual cases of production workloads later on in the post. Synthetic load generators were not used here because they cannot properly simulate a pattern of activity that is reflective of a real environment. Synthetic load generators are good at stressing resources – not simulating real world workloads, or the time it takes for those workloads to complete their tasks.
Interpreting impacts on CPU usage and CPU Ready with changing storage performance
Looking at CPU utilization can be challenging because not all applications, nor the workloads they generate are the same. Most applications are a complex mix of some processes being multithreaded, while others are not. Some processes initiate storage I/O, while others do not. It is for this reason that we will look at CPU Usage and CPU Ready over a task that is repeated on the same sets of VMs, but using storage that performs differently.
For all practical purposes, CPU Ready doesn’t become meaningful until a host is running a large number of single vCPU VMs concurrently, or a number of multiple vCPU VMs concurrently. CPU Ready can sometimes be terribly tricky to decipher because it can be influenced in so many ways. Sometimes it may align with CPU utilization, while other times it may not. It may be affected by other resources, or it may not. It really depends on the environmental conditions. I find it a good supporting metric, but definitely not one that should stand on its own merit, without proper context of other metrics. We are measuring it here because it is generally regarded as important, and one that may contribute to load distribution activities.
Test 1: Single vCPU VM on a Host with no other activity
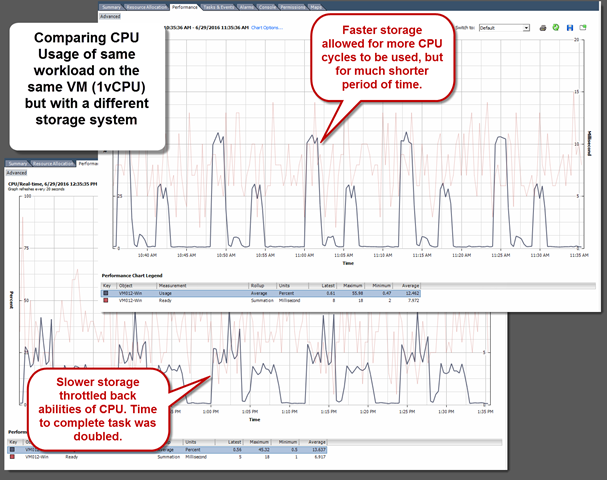
First let’s look at one of the very simplest of comparisons. A single vCPU VM with no other activity occurring on the host, where one test is using slower storage (blue), and the other test it is using faster storage (orange). A task was completed 5 times over the course of one hour. The image below shows that from the host perspective, peak CPU utilization increased by 79% when using the faster storage. CPU Ready demonstrated very little change, which was as expected due to the nature of this test (no other VMs running on the host).
When we look at the individual VMs, the results are similar. The images below show that CPU usage maximums for the VM increased by 24% when using the faster storage. CPU Ready demonstrated very little change here because there were no other VMs to contend with on that host. The "Storage Latency" column shows the average storage latency the VM was seeing during this time period.
You might think that higher latency may not be realistic of today’s storage technologies. The "slower" storage in this case did in fact come from SSD based storage. But remember that Flash of any kind can suffer in performance when committing larger block I/O which is quite common with real workloads. Take a look at "Understanding block sizes in a virtualized environment" for more information.
But wait… how long did the task, set to run 5 times over the period of one hour take? Well, the task took just half the time to run with the faster storage. The same amount of cycles were processing the same amount of I/Os, but just for a shorter period of time. This faster completion of a task will free up those CPU cycles for other VMs. This is the primary reason why the averages for CPU Usage and CPU Ready changed very little. Looking at this data in a timeline form in vCenter illustrates it quite clearly. There is a clear distinction of the characteristics of the task on the fast storage. Much more difficult to decipher on the run with slower storage.
Test 2: Multiple vCPU VM on a host with other activity
Now let’s let the same workload run on VMs with assigned multiple (4) vCPUs, along with other multi-vCPU VMs running in the background. This is to simulate a bit of "chatter" or activity that one might experience in a production environment.
As we can see from the images below, on the host level, both CPU usage and CPU ready values increased as storage performance increased. CPU usage maximums increased by 39% on the host. CPU Ready maximums increased by 34% on the host, which was a noticeable difference than testing without any other systems running.
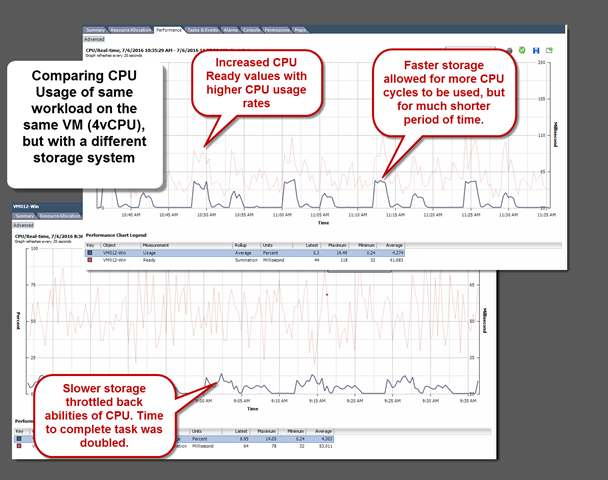
When we look at the individual VMs, the results are similar. The images below show that CPU usage maximums increased by 39% with the faster storage. CPU Ready maximums increased by 51% while running on the faster storage. Considering the typical VM to host consolidation ratio, the effects can be profound.
Now let’s take a look at the timeline in vCenter to get an appreciation of how those CPU cycles were used. On the image below, you can see that like the single vCPU VM testing, the VM running on faster storage allowed for much higher CPU usage than when running on slower storage, but that it was for a much shorter period of time (about half). You will notice that in this test, the CPU Ready measurements generally increases as the CPU usage increased.
Real world examples
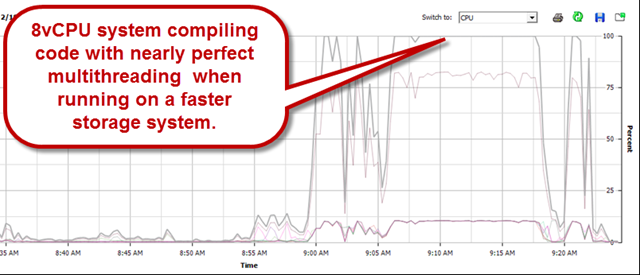
This all brings me back to what I witnessed years ago while administering a vSphere environment consisting of extremely CPU and storage I/O intensive workloads. Dozens of resource intensive VMs built for the purpose of compiling code. These were systems using that could multithread to near perfection – assuming storage performance was sufficient.
Now let’s look at what CPU utilization rates looked like on that same VM, running the same code compiling job where the storage environment wasn’t able to satisfy reads and writes fast enough. The same job took 46% longer to complete, all because the available CPU cycles couldn’t be used.
Still not a believer? Take a look at a presentation at the OpenStack summit by Charter Communications in April 2016, where they demonstrate exactly the effect I describe. Their Cassandra cluster deployed with VMware Integrated OpenStack, and the effects of CPU utilization when providing lower latency, higher performing storage. (key information beginning at 17:10). Their more freely breathing storage allowed CPU cycles related to storage I/O to be committed more quickly, thereby finishing the tasks much more quickly. High CPU usage was a desired result of theirs.
You might be thinking to yourself, "Won’t I have more CPU contention with faster storage?" Well, yes and no. Faster storage will give power back to the Administrator to control the usage of resources as needed, and deliver the SLAs required. And moving the point of contention to the CPU allows for what it does best; time slicing processes to complete the tasks as quickly as possible.
Sample what?
The rate at which telemetry data is sampled is a factor that can dramatically change your impression of the behavior of these resources used in the Data Center. It’s a big topic, and one that will be touched on in an upcoming post, but there is one thing to note here. When leveraging faster, lower latency storage, there are many times where CPU utilization and CPU Ready will stay the same. Why? In a real workload that involve CPU cycles executing to commit storage I/O, a workflow can may consist of a given amount of those I/Os, regardless of how long it takes. If that process took 18 seconds on slow storage, but 5 seconds on faster storage, the 20 second sampling rate within vCenter may render it in the same way. One often has to employ other tools to see these figures at a higher sampling rate. Tools such as vscsiStats and esxtop are good examples of this.
Takeaways
The testing, and examples above should make it easy to imagine a scenario in which a storage system is upgraded, and CPU related alarms are tripped more frequently, even though the processes that support a workflow have completed much more quickly. So with that, it’s good to keep the following in mind.
- Slow storage will suppress CPU utilization rates – giving you the impression that from a host, or VM perspective, everything is fine.
- Conversely, Fast storage will allow those CPU cycles related to storage I/O to execute, thereby increasing utilization rates – albeit for a shorter period of time. High CPU statistics are not necessarily a bad thing.
- Averages and peaks can be misleading because increased utilization rates may not be recognizable in the vCenter CPU charts if it completes within the smallest sampling size (20 seconds)
- Traditional methods of monitoring and balancing host resources can be misleading
- Higher CPU utilization rates may not be a leading indicator of an issue. They are often be a trailing indicator of well-designed processes, or free breathing storage. Again, high CPU can be a good thing!!!
- Application behavior, and the results are what counts. If a batch job in SQL takes 30 minutes, defining success should be around the desired time of that batch job. Infrastructure related metrics should help you diagnose issues and assist with achieving a desired result, but not be the one and only KPI.
- Storage performance will generally impact every VM and host accessing the cluster. Whereas host based resource contention will only impact other VMs living on that same host.
Thanks for reading
– Pete


